Any top 10 list of ideal food usage problems should include the open food key on your POS system. Take a look at your product mix report and find open food as a percentage of food sales. A worst case scenario involves over 10% of food sales attributed to open food. Less than one half of one percent is a good target. Your operation probably runs somewhere between these extremes. The higher the open food sales as a percent of total food, the lower your chance of success in calculating an accurate ideal usage.
Large buffet sales may hamper ideal food cost calculation. This is not the case in all operations. Many chefs are fantastic with buffet control. I've seen higher variances in operations with a high buffet sales component. Buffet recipes are tricky and many operators give up on developing a complex recipe model.
Menu item explosion can implode the ideal usage calculation. The more items on the menu, the lower the chance of accurate food cost prediction. Focused menus with very few specials represent your best option. When it is impossible to offer a menu with a tight focus, try to view your menu in logical sections. These sections should focus on a particular food category (e.g. steaks, seafood, etc.). Some sections will be more kind to the recipe team. Calculate a separate ideal usage percentage for each section.
In general, the greater the yield variance in producing an entree portion the lower the probability of accurate ideal usage calculation. Try a simple exercise. Take 90 days of purchase history on any large meat cut used to produce a popular menu item. Simply enter the weights per piece in a column of a spreadsheet. Calculate the average weight per piece and the standard deviation. As the standard deviation expressed as a percentage of the average weight increases, your chance of accurate standard recipe creation declines. Consider portion control items whenever you experience huge variances in usage on entrees cut from large meat cuts.
If you develop each day's menu in the morning at the market, your chance of accurately predicting ideal usage may be zero. I have never seen a market driven menu with a tight difference between actual and ideal. The higher the percentage of sales generated by specials, the lower your chance in consistently hitting an ideal number. Production and prep activities will be closely tied to your purchases. Actual sales may differ widely.
Low sales volume will hinder any attempt at ideal usage calculation. Combined with an unwieldy menu, low sales volume can spell disaster. When the sales are extremely low, all efforts to control costs should take a lower priority. Your menu strategy is failing and the market has spoken. Try a smaller, easier to produce menu and get the word out in the press. Offer some promotions and solicit customer criticism. Go with the winners and cut all the menu dogs.
Consistent food cost results are a function of logical menu mix, tight menu focus, excellent POS menu setup, limited specials and buffets, predictable portion yields and a profitable sales volume. If your attempts at ideal usage calculation have been disappointing in the past, examine your operation and eliminate the obstacles to success. Find the ingredients which are always in the top variance list. Make an easier to track production method for these problem items. Better results happen one ingredient at a time.
Click Here For More Information
Senin, 26 Juni 2006
Selasa, 20 Juni 2006
Perpetual Inventory-Stratified Random Sampling
My final review with the RCA Corporate Audit staff involved the Accounts Receivable sub-ledger at the global telecommunications subsidiary. By the time I was asked to help, the job was already over the budgeted time and everyone was under the gun to get the report to management. To keep costs at a minimum, I requested interns from Rutgers Graduate School of Business.
During training conducted by the Arthur Young CPA firm, I became the statistical sampling "expert" when I corrected the instructor on the final day. Arthur Young had an excellent sampling tool and I asked my boss if we could try stratified random sampling to help with the project deadline.
Basically, a stratified sample focuses more attention on higher impact accounts (in this case customer records). We examined the printout of sample selections and found we were to examine the top 5 customers and a representative sample from each of the other strata. I won't discuss our results but I was promoted based on the report findings and the relative speed in which we concluded the review.
Many of the benefits of stratified sampling may be utilized in operations where a strong reliance is placed on perpetual inventory calculations. People using perpetual counts often need to make spot checks to verify the results of the ideal usage formula. So what items should you spot check?
I would recommend checking every item in your top 25 purchased goods list. Since you won't be scrutinized by Arthur Young accountants, it's up to you to decide how many additional items need checking between physical counts. To give you an idea of the power of sampling, we used around 350 accounts in a universe with tens of thousands. Our limited review located critical control issues and we brought them to management's attention in a timely manner.
If you have 1,000 items in stock, check 5 or less shelf stable dry goods. With your top 25, this will make 30 items. Try to randomly check another 25 to 50 (depending on time required). Now the fun begins as you try to reconcile the perpetual inventory level calculated vs. the actual amount on the shelf. The first five or six spot checks will point out obvious recipe errors and yield issues. Since you're sampling you should expect problems found for a particular class of items (for example produce) may require more intensive work on the entire class.
When you find a problem with portion control items and the recipes are solid, note the dates of the last physical count and the spot check date. Mark any of these problem items for increased scrutiny. You may consider control sheets located near the walkin coolers and freezers.
The use of spot checks and sampling techniques will greatly improve results in operations where physical counts are required monthly. If you count everything each week, your mid-week spot counts may be very brief and focused. Some operators count the top 25 daily. This should suffice for most weekly count operators.
An excellent additional benefit of perpetual inventory spot checks is the refinement of recipes used in the calculations. Accurate recipe costs and ingredient yields are requirements in more sophisticated menu engineering calculations.
Click Here For More Information
During training conducted by the Arthur Young CPA firm, I became the statistical sampling "expert" when I corrected the instructor on the final day. Arthur Young had an excellent sampling tool and I asked my boss if we could try stratified random sampling to help with the project deadline.
Basically, a stratified sample focuses more attention on higher impact accounts (in this case customer records). We examined the printout of sample selections and found we were to examine the top 5 customers and a representative sample from each of the other strata. I won't discuss our results but I was promoted based on the report findings and the relative speed in which we concluded the review.
Many of the benefits of stratified sampling may be utilized in operations where a strong reliance is placed on perpetual inventory calculations. People using perpetual counts often need to make spot checks to verify the results of the ideal usage formula. So what items should you spot check?
I would recommend checking every item in your top 25 purchased goods list. Since you won't be scrutinized by Arthur Young accountants, it's up to you to decide how many additional items need checking between physical counts. To give you an idea of the power of sampling, we used around 350 accounts in a universe with tens of thousands. Our limited review located critical control issues and we brought them to management's attention in a timely manner.
If you have 1,000 items in stock, check 5 or less shelf stable dry goods. With your top 25, this will make 30 items. Try to randomly check another 25 to 50 (depending on time required). Now the fun begins as you try to reconcile the perpetual inventory level calculated vs. the actual amount on the shelf. The first five or six spot checks will point out obvious recipe errors and yield issues. Since you're sampling you should expect problems found for a particular class of items (for example produce) may require more intensive work on the entire class.
When you find a problem with portion control items and the recipes are solid, note the dates of the last physical count and the spot check date. Mark any of these problem items for increased scrutiny. You may consider control sheets located near the walkin coolers and freezers.
The use of spot checks and sampling techniques will greatly improve results in operations where physical counts are required monthly. If you count everything each week, your mid-week spot counts may be very brief and focused. Some operators count the top 25 daily. This should suffice for most weekly count operators.
An excellent additional benefit of perpetual inventory spot checks is the refinement of recipes used in the calculations. Accurate recipe costs and ingredient yields are requirements in more sophisticated menu engineering calculations.
Click Here For More Information
Jumat, 16 Juni 2006
Prime vs. Choice
I decided to take a look at the price differential between prime and choice grades for the popular beef cuts. The NAMP numbers for the 5 cuts are 112A, 174, 180, 184 and 189A. My source is www.foodservice.com and I used market data from early 2005 through this month. The sample includes every fourth report and my prices represent the averages. The chart shows average market cost per pound for each cut.
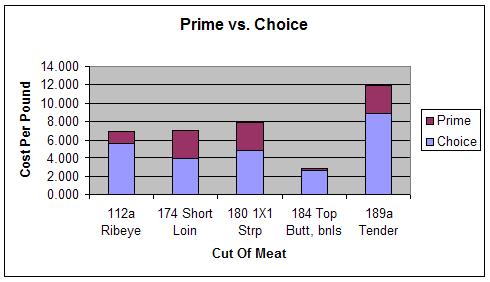
Porterhouse Steaks cut from prime Short Loin 174 cost 80% more than choice. New York Strip Steaks cut from prime Strip 1x1 180 cost 62% more than choice. Tenderloin looks like a bargain. Prime Tender 189A costs about 34% more than choice. Finally, a prime Sirloin Steak cut from a Top Butt 184 will cost about 8% more than choice.

Click Here For More Information
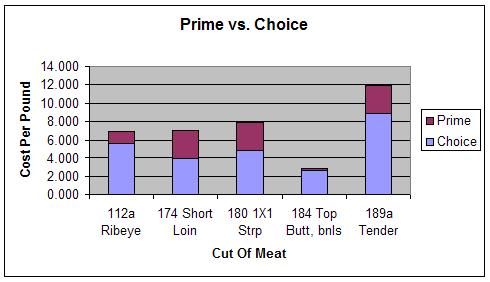
Porterhouse Steaks cut from prime Short Loin 174 cost 80% more than choice. New York Strip Steaks cut from prime Strip 1x1 180 cost 62% more than choice. Tenderloin looks like a bargain. Prime Tender 189A costs about 34% more than choice. Finally, a prime Sirloin Steak cut from a Top Butt 184 will cost about 8% more than choice.

Click Here For More Information
Langganan:
Postingan (Atom)
